
How To Use the DigitalOcean ELK Stack One-Click Application
This One-Click is no longer available - But you can still run ELK on DigitalOcean!
The best way to get started today is to reference one of the below tutorials, covering installation of the ELK stack (that is, Elasticsearch 2.3.x, Logstash 2.3.x, and Kibana 4.5.x) starting from a new Ubuntu or Centos server.
| UBUNTU USERS: | CENTOS USERS: |
|---|---|
 How To Install Elasticsearch, Logstash, and Kibana (ELK Stack) on Ubuntu 16.04 How To Install Elasticsearch, Logstash, and Kibana (ELK Stack) on Ubuntu 16.04 |
 How To Install Elasticsearch, Logstash, and Kibana (ELK Stack) on Centos 7 How To Install Elasticsearch, Logstash, and Kibana (ELK Stack) on Centos 7 |
The DigitalOcean ELK Stack One-Click Application provides you with a quick way to launch a centralized logging server. The ELK Stack is made up of three key pieces of software: Elasticsearch, Logstash, and Kibana. Together they allow you to collect, search, and analyze logs files from across your infrastructure. Logstash collects and parses the incoming logs, Elasticsearch indexes them, and Kibana gives you a powerful web interface to visualize the data.
This tutorial will show you how to launch an ELK instance and set up Filebeat on your other servers to send their logs to your new centralized logging server.
Creating the ELK Stack Droplet
To begin using it, simply create a droplet and specify your hostname and size. It’s recommended that you run ELK Stack on at least a 2GB droplet.

Select your desired region:

Select ELK Stack on Ubuntu 14.04 from the Applications tab:

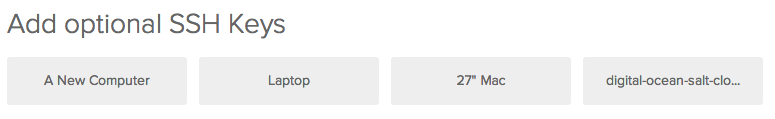
If you use SSH keys to manage your droplets, which are more secure than passwords and are recommended, you can also specify which ones you want added to this server.
Access Your Kibana Credentials
Once your server has been spun up, you will be able to access the Kibana frontend in a web browser via its IP address. However, this has been password protected. In order to retrieve the randomly generated password, you will need to access the server via the command line.
You can log into your droplet with the following command:
ssh root@your_ip_address
If you are prompted for a password, type in the password that was emailed to you when the server was created. Alternately, if you set up the droplet with SSH keys, you can go ahead and log in without the need for a password.
Once you are logged in, you will see the message of the day (MOTD) which contains your password. It will look like this:
-------------------------------------------------------------------------------------
Thank you for using DigitalOcean's ELK Stack Application.

Your Kibana instance can be accessed at http://xxx.xxx.xx.xxx/
Your Kibana login credentials are:
Username: admin
Password: XXXXXXXXXX
-------------------------------------------------------------------------------------
Now that you have your login credentials, you can access Kibana by entering its IP address in your browser and providing your username and password.
Using Kibana
Kibana is highly configurable. You can create custom dashboards with filtered searches and visualizations of you data. By default, the ELK One-Click is set up to collect the syslog and Nginx access log from the droplet itself. So you should already have data to look at when you first login.
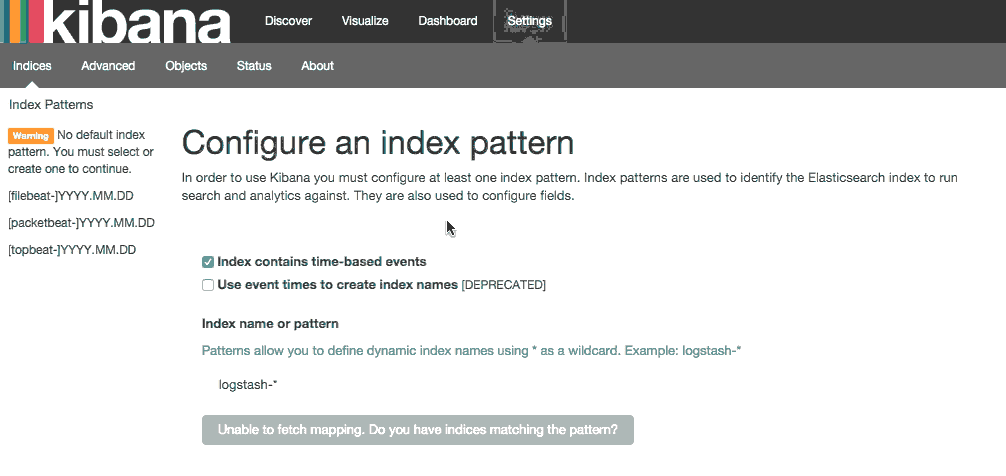
In order to begin viewing your data, you first must configure an index pattern. This can be done by selecting [filebeat]-YYY.MM.DD from the Index Patterns menu on the left and then clicking the Star button to set it as the default index.
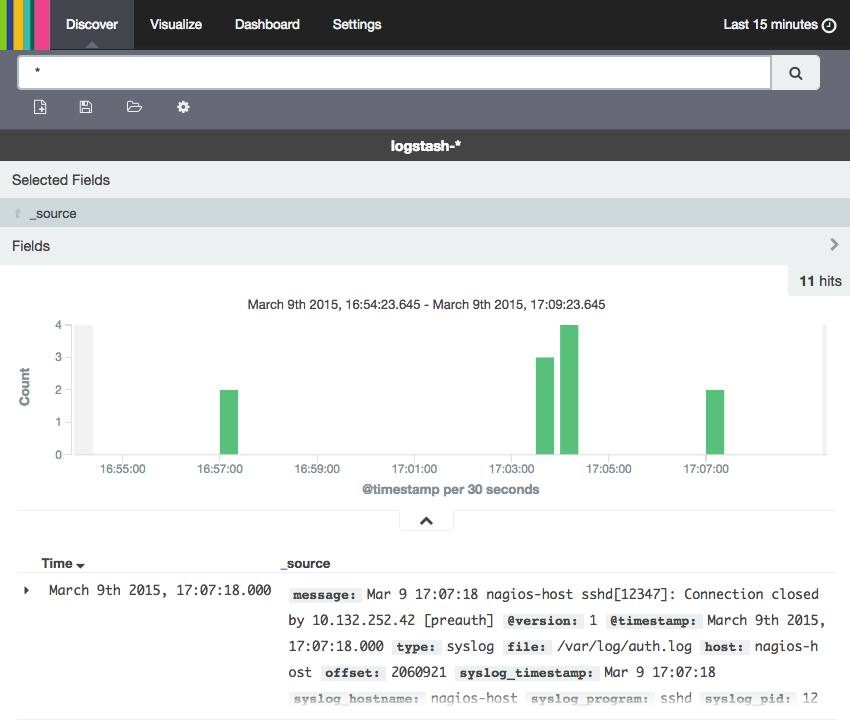
Click Discover in the top navigation bar to view the logs that have already been created:
To explore more ways to visualize your data, check out the following tutorial:
Forwarding Logs
In order to send logs to your ELK server, you will need to install and configure Filebeat on your other servers. This tutorial is focused on installing it on Ubuntu, but you can also forward logs from servers running CentOS as well.
We will now configure a client server to send it's syslog to your ELK server.
Installing The SSL Certificate
In order to encrypt traffic when sending your logs to your ELK server, a self-signed SSL certificate is created on first boot. You must install this certificate on each client server. On your ELK server, run this command to copy the SSL certificate to a client server:
- scp /etc/pki/tls/certs/logstash-forwarder.crt user@client.ip.address:/tmp
The SSL certificate will now be present in the /tmp folder on the client server. Now you must install it to the correct directory:
sudo mkdir -p /etc/pki/tls/certs
sudo cp /tmp/logstash-forwarder.crt /etc/pki/tls/certs/
Installing Filebeat
On client server, add the Logstash Forwarder repository to your APT sources and download its signing key:
- wget -O - http://packages.elasticsearch.org/GPG-KEY-elasticsearch | sudo apt-key add -
- echo 'deb https://packages.elastic.co/beats/apt stable main' | sudo tee /etc/apt/sources.list.d/filebeat.list
Then install the Logstash Forwarder package:
- sudo apt-get update
- sudo apt-get install filebeat
Next, you will want to ensure that Logstash Forwarder will automatically start on boot:
- sudo update-rc.d filebeat defaults
Configure Filebeat
On the client server, create and edit Logstash Forwarder's configuration file, which is in YAML format:
- sudo nano /etc/filebeat/filebeat.yml
The file will include many commented out options. Here we will use the defaults in most cases. We will configure Filebeat to connect to your ELK server on port 5044 and use the SSL certificate that you installed earlier. The paths section specifies which log files to send, and the document_type section specifies that these logs are of type "syslog" (which is the type that our filter is looking for).
Removing the commented out options and substituting in your ELK server's IP address for elk_server_IP, your Filebeat configuration would look like:
filebeat:
  prospectors:
    -
      paths:
        - /var/log/auth.log
        - /var/log/syslog
      input_type: log
      document_type: syslog
output:
  logstash:
    hosts: ["elk_server_IP:5044"]
    tls:
      certificate_authorities: ["/etc/pki/tls/certs/logstash-forwarder.crt"]
Save and quit. Now restart Filebeat to put our changes into place:
sudo service filebeat restart
Now Filebeat is sending syslog to your ELK Server!
Automatically Install On New Droplets
You will need to repeat this process for all of your other existing servers that you wish to gather logs for, but you can streamline this process when you create a new server using DigitalOcean's metadata service. When creating a new droplet, you can provide a cloud-config file which will automatically configure Logstash Forwarder as your droplet first boots.
In order to do so, you must copy the contents of the SSL certificate from your ELK server. You can view the file by running:
cat /etc/pki/tls/certs/logstash-forwarder.crt
Now you can create a cloud-config file automating the steps we took above:
#cloud-config
write_files:
  - content: |
      -----BEGIN CERTIFICATE-----
      MIIDXTCCAkWsdERgfgIJAP1eIkzku0apMA0GCSqGSIb3DQEBCwUAMEUxCzAJBgNV
      BAYTAkFVMRMwEQYDVQQIDApTb21lLVN0YXRlMSEwHwYDVQQKDBhJbnRlcm5ldCBX
      aWRnaXRzIFB0eSBMdGQwHhcNMTQxMjA0MjExNDQ4WhcNMjQxMjAxMjExNDQ4WjBF
      MQswCQYDVQQGEwJBVTETSDFUIQUECAwKU29tZS1TdGF0ZTEhMB8GA1UECgwYSW50
      ZXJuZXQgV2lkZ2l0cyBQdHkgTHRkMIIBIjANBgkqhkiG9w0BAQEFAAOCAQ8AMIIB
      CgKCAQEAo3I1IQzaZPFHdfgSes3uqcan8EqcObLy8nFPqHn8fmLT+AfA4JnVSB6S
      dl/qYOUoKI4mFaQROhaC+VWV2E0sB42pv5jKZfC8orHTuY23eXnZFeajGVqIQhu3
      4VIv56l/nSnS30t/ryPAyDqrb+hPT1HNc92ruobTLlKl1XVgBfHqldUHVHPk99Gv
      xRLQQKg/EIZkFyGYMi770N9vR3usBuaAuPX78RmNGoiNYRAJDKJ2vvU86mGqoMow
      Bw9mICaVv94P9z8vROPHI1IZnlKKjDKqvSvfyR1J4H2hCP6yoGmYbz9DHfOqnWie
      J1u7DZ5YeIgZIy2TWqaaTVDgwjb3AwIFGWSUo1AwTjAdBgNVHQ4EFgQUXsvZ6xD7
      1PfKJbPBmYHnUsWsZ5UwHwYDVR0jBBgwFoAUXsvZ6xD71PfKJbPBmYHnUsWsZ5Uw
      DAYDVR0TBAUwAwEB/zANBgkqhkiG9w0BAQsFAAOCAQEAdqnijWlcsbk8A1L4yfQa
      Dm172P7hatN3fh4lmPoVsd5sMPmYsYOFZ6Vk9MIFg+ibeV42n+OtYb31lJq76nKF
      IYR+zuDyEAVkmZEA7Sb3zQDGH0qqC12ztiAbBw+XsD3s1a8VaqHk3AuvD35xURKK
      +fy2kbnoFZ0yFsDcr+h442PVrvShMYtKcVKquuHs8TJolON3bvZCLyK0YqHtnHPN
      QoWI5Si7ojsSnUPLBZqaSGUQu8UipMLJk+HvbbVt1purI3mH3/tB3D1gnSiTGRGD
      vXvw8/qDgPAT5fWW5OniVWUsYlNNs2irTqTSI7aBh6QPcxpmcOFkctsRTSWz/Mrz
      qQ==
      -----END CERTIFICATE-----
    path: /etc/pki/tls/certs/logstash-forwarder.crt
  - content: |
      filebeat:
        prospectors:
          -
            paths:
              - /var/log/auth.log
              - /var/log/syslog
            input_type: log
            document_type: syslog
      output:
        logstash:
          hosts: ["HOST_IP_ADDR:5044"]
          tls:
            certificate_authorities: ["/etc/pki/tls/certs/logstash-forwarder.crt"]
    path: /etc/filebeat/filebeat.yml
runcmd:
  - wget -O - http://packages.elasticsearch.org/GPG-KEY-elasticsearch | sudo apt-key add -
  - echo 'deb https://packages.elastic.co/beats/apt stable main' | sudo tee /etc/apt/sources.list.d/filebeat.list
  - sudo apt-get update
  - sudo apt-get install filebeat
  - sudo update-rc.d filebeat defaults
  - sudo service filebeat start
Make sure to replace the contents of the certificate with your own, including the lines with BEGIN and END, as well as the IP address of your ELK server.
Now, when creating a new droplet, you can paste this file into the Enable User Data field:

As your new server comes online, new data will start flowing to your ELK server and be visible in Kibana.
Further information
In order to process the logs it receives, Logstash needs to filter the files and extract formatted data as different log files have very different formats. These filters are installed to /etc/logstash/conf.d/ By default, the ELK Stack application has filters for syslog and for Nginx's access log. For instance, here is /etc/logstash/conf.d/10-syslog.conf
filter {
  if [type] == "syslog" {
    grok {
      match => { "message" => "%{SYSLOGTIMESTAMP:syslog_timestamp} %{SYSLOGHOST:syslog_hostname} %{DATA:syslog_program}(?:\[%{POSINT:syslog_pid}\])?: %{GREEDYDATA:syslog_message}" }
      add_field => [ "received_at", "%{@timestamp}" ]
      add_field => [ "received_from", "%{host}" ]
    }
    syslog_pri { }
    date {
      match => [ "syslog_timestamp", "MMM  d HH:mm:ss", "MMM dd HH:mm:ss" ]
    }
  }
}
For more information on how to write Logstash filters, and an example Apache filter, check out this tutorial:
This One-Click is no longer available - But you can still run ELK on DigitalOcean!
The best way to get started today is to reference one of the below tutorials, covering installation of the ELK stack (that is, Elasticsearch 2.3.x, Logstash 2.3.x, and Kibana 4.5.x) starting from a new Ubuntu or Centos server.
| UBUNTU USERS: | CENTOS USERS: |
|---|---|
| How To Install Elasticsearch, Logstash, and Kibana (ELK Stack) on Ubuntu 16.04 |
How To Install Elasticsearch, Logstash, and Kibana (ELK Stack) on Centos 7 |

32 Comments